Tuesday, September 5, 2017

Serpentine or Bag of Warms sign.

A) Discussion:

1- Is a high flow vascular malformation with abnormal arteriovenous shunting with no intervening capillary bed.

2-Communication could be either by a nidus or fistulous communication.
3-At imaging, the nidus appears as tortuous bag of warm appearance with early arterial and venous enhancement.
4-Complications include hemorrhage, infarction, seizures and hydrocephalus.
5- Spetzler- Martin Grading for post operative evaluation by evaluating nidus size as follow:
 1 point: < 3 cm, 2 points: 3- 6 cm, 3 points: > 6 cm. 
Venous drainage: (0 point: superficial, 1 point: deep).
Eloquence of adjacent brain (0 points: non eloquent, 1 point: eloquent).
Martin grades range from 1 to 5, with 6 being reserved for non operative candidates.

B) Diagnosis:


-AVM.


C) Imaging:
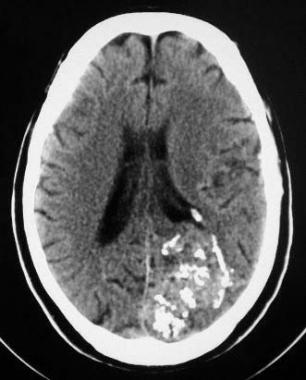


A CT scan of the head that demonstrates a left occipital arteriovenous malformation (AVM), with multiple calcified phleboliths and numerous hyperattenuating vascular channels.
Arteriovenous malformation (AVM) of the brain. An axial T2-weighted MRI showing numerous flow voids corresponding to the CT findings (not shown). Note the mass effect on the lateral ventricle despite the lack of a mass or hemorrhage.


D) Dynamic study of AVM:


MR-DSA methodology was modified from Aoki et al (19). Sixty images were obtained using an RF-spoiled 2D Fourier-transformation steady-state technique, which permits one image per second. Imaging parameters for the gradient-echo sequence were 7/2 (TR/TE), a 40° flip angle, a 23-cm FOV, a 256 × 150 matrix, and a slice thickness of 6 to 10 cm. The phase sample ratio was 1.0 and the bandwidth was 50.0 kHz. Slices were orientated to give projections equivalent to those produced by CCA. In any given imaging domain (axial, lateral, reverse Towne), one run was conducted as a mask and a second run was obtained during the passage of a bolus of 6 to 10 mL (concentration, 0.5 M) of gadopentetate dimeglumine followed by a 10-mL saline flush. A separate contrast bolus was used for each anatomic projection. This was administered at a rate of 3 mL/s via a power injector (Medrad Spectris, Medrad, Netherlands) through an 18-gauge intravenous cannula inserted into the antecubital fossa vein (21). The quantity of contrast material varied according to nidus size, as determined from the standard fast spin-echo images, to optimize nidus visualization: 6 mL of full-strength gadopentetate dimeglumine was used for small (<3 cm) AVMs and 10 mL for medium-sized (3–6 cm) AVMs. After imaging, the mask run for a particular imaging plane was subtracted from the contrast run using proprietary software, and then viewed using video reversed cine. A maximum of 20 mL of gadopentetate dimeglumine was administered to any one patient.


54-year-old patient with Wyburn-Mason syndrome and bilateral mirror-image parietal AVMs.
A, Axial T2-weighted (2900/87.5/2) image shows flow voids in both AVMs and the set-up acquisition block for the anteroposterior projection MR-DSA. Note that the anterior cerebral arteries are not included.
B, Right carotid selective conventional catheter angiogram shows the right-sided AVM.
C–E, Several stages of MR-DSA during the passage of a contrast bolus in a Towne projection. Early arterial phase (C), late arterial phase (D), and early venous phase (E).


Reference 1
Reference2

Monday, September 4, 2017

Dense Venous Sinus.

19-year-old female with thrombosis (arrow) of the left transverse sinus (LTS) (A) and superior sagittal sinus (C), confirmed by CT venography in sagittal (B) and axial (D) reconstruction. Average attenuation inside the LTS was 83.6 HU (HU unit is valiable above 64 HU).
A) Anatomy:


Anatomy


B) When to think of venous thrombosis:


C) Radiological Signs:


Normally veins are slightly denser than brain tissue and in some cases it is difficult to say whether the vein is normal or too dense .
In these cases a contrast enhanced scan is necessary to solve this problem.


Visualization of a thrombosed cortical vein that is seen as a linear or cord-like density, is also known as the cord sign.
Another term that is frequently used, is the dense vessel sign.


Images of a patient with a hemorrhagic infarction in the temporal lobe (red arrow).
Notice the dense transverse sinus due to thrombosis (blue arrows).


The empty delta sign is a finding that is seen on a contrast enhanced CT (CECT) and was first described in thrombosis of the superior sagittal sinus.
The sign consists of a triangular area of enhancement with a relatively low-attenuating center, which is the thrombosed sinus. 


 A case of thrombosis of the right transverse sinus and the left transverse and sigmoid sinus (arrows).
There is enhancement surrounding the thrombosed hypoattenuating veins.


A T2-weighted image with normal flow void in the right sigmoid sinus and jugular vein (blue arrow).
On the left there is abnormal high signal as a result of thrombosis (red arrow).


Bilateral almost par sagittal symmetrical area of infarction due to sagittal sinus thrombosis.


Venous infarction

The other sign that can help you in making the diagnosis of unsuspected venous thrombosis is venous infarction.
Venous thrombosis leads to a high venous pressure which first results in vasogenic edema in the white matter of the affected area.
When the proces continues it may lead to infarction and development of cytotoxic edema next to the vasogenic edema.
This is unlike in an arterial infarction in which there is only cytotoxic edema and no vasogenic edema.
Due to the high venous pressure hemorrhage is seen more frequently in venous infarction compared to arterial infarction.
Since we are not 
that familiar with venous infarctions, we often think of them as infarctions in an atypical location or in a non-arterial distribution. 
However venous infarctions do have a typical distribution, as shown on the figure above.


Since many veins are midline structures, venous infarcts are often bilateral.
This is seen in thrombosis of the superior sagittal sinus, straight sinus and the internal cerebral veins.


The most frequently thrombosed venous structure is the superior sagittal sinus.
Infarction is seen in 75% of cases.
The abnormalities are parasagittal and frequently bilateral.
Hemorrhage is seen in 60% of the cases.
On the left bilateral parasagittal edema and subte hemorrhage in a patient with thrombosis of the superior sagittal sinus.


Another typical venous infarction is due to thrombosis of the vein of Labbe.
On the left images demonstrating hypodensity in the white matter and less pronounced in the gray matter of the left temporal lobe.
There is a broad differential diagnosis including arterial infarction, infection, tumor etc.
Notice that there is some linear density within the infarcted area.
This is due to hemorrhage.
In the differential diagnosis we also should include a venous infarct in the territory of the vein of Labbe.
The subtle density in the area of the left transverse sinus (arrow) is the key to the diagnosis.
This is a direct sign of thrombosis and the next step is a CECT, which confirmed the diagnosis (not shown).


There is a combination of vasogenic edema (red arrow), cytotoxic edema and hemorrhage (blue arrow).
These findings and the location in the temporal lobe, should make you think of venous infarction due to thrombosis of the vein of Labbe.
The next examination should be a contrast enhanced MR or CT to prove the diagnosis.


A FLAIR image demonstrating high signal in the left thalamus.
When you look closely and you may have to enlarge the image to appreciate this, there is also high signal in the basal ganglia on the right.
These bilateral findings should raise the suspicion of deep cerebral venous thrombosis.
A sagittal CT reconstruction demonstrates a filling defect in the straight sinus and the vein of Galen (arrows).


A young patient with bilateral abnormalities in the region of the basal ganglia.
Based on the imaging findings there is a broad differential including small vessel disease, demyelinisation, intoxication and metabolic disorders.
Continue with the T1-weighted images in this patient.


Notice the abnormal high signal in the internal cerebral veins and straight sinus on the T1-weighted images, where there should be a low signal due to flow void.
This was unlike the low signal in other sinuses.
The diagnosis is bilateral infarctions in the basal ganglia due to deep cerebral venous thrombosis.


MR Venography:


The MR-techniques that are used for the diagnosis of cerebral venous thrombosis are:
Time-of-flight (TOF), phase-contrast angiography (PCA) and contrast-enhanced MR-venography:
  • Time-of-Flight angiography is based on the phenomenon of flow-related enhancement of spins entering into an imaging slice.
    As a result of being unsaturated, these spins give more signal that surrounding saturated spins.
  • Phase-contrast angiography uses the principle that spins in blood that is moving in the same direction as a magnetic field gradient develop a phase shift that is proportional to the velocity of the spins.
    This information can be used to determine the velocity of the spins. This image can be subtracted from the image, that is acquired without the velocity encoding gradients, to obtain an angiogram.
  • Contrast-enhanced MR-venography uses the T1-shortening of Gadolinium.
    It is similar to contrast-enhanced CT-venography.


Right transverse sinus thrombosis.


When you use MIP-projections, always look at the source images.


A lateral and oblique MIP image from a normal contrast-enhanced MR venography.
Notice the prominent vein of Trolard (red arrow) and vein of Labbe (blue arrow).
Every MR techniques has its own pitfalls as we will discuss in a moment.
Contrast-enhanced MR venography has the disadvantage that you need to give contrast, but has less pitfalls.


an illustration of the territories of the venous drainage.
There is great variation in these territories and the illustration should be regarded as a rough guide.


Reference

Sunday, September 3, 2017

Hyperdense MCA Sign and the "GRE susceptibility vessel sign (GRE SVS)".

Middle cerebral artery dense sign.


Diffusion weighted imaging (DWI) of a patient shows high signal intensity in the right middle cerebral artery (MCA) territory (A). On magnetic resonance angiography (MRA) showing the area, corresponding to the DWI of (A), a right M1 occlusion is present (B). A gradient echo image susceptibility vessel sign (GRE SVS) is shown on a GRE image (C; white arrow). The cross-sectional area of the thrombus was calculated using the Picture Archiving and Communication System (PACS; Maroview version 5.4, MAROTECH Inc., Seoul, Korea). In this case, the calculated cross-sectional area of the thrombus was 25.07 mm2 (D).


Acute ischemic stroke is an event of the highest urgency. Persistent major cerebral arterial occlusion is associated with high mortality and poor neurologic outcome., Recanalization using intravenous administration of tissue plasminogen activator (IV-tPA) or intra-arterial chemical thrombolysis (IAT) has been shown to improve patient outcome.,, Endovascular mechanical thrombectomy (MT) has recently been shown to induce high-grade, rapid recanalization, resulting in favorable clinical outcomes.,,

To date, several studies have reported on the usefulness of assessment of thrombus burden using computed tomography (CT) angiography in prediction of clinical and radiologic outcomes.,, In addition, a small number of studies using magnetic resonance image (MRI) for estimation of treatment outcomes and thrombus burdens have been reported. Cho et al. suggested that the magnetic susceptibility effect of deoxyhemoglobin in intraluminal clots, which appears as a hypointense signal on T2*-weighted gradient echo (GRE) images, might predict cardioembolic stroke and subsequent recanalization. These authors termed this radiologic finding the "GRE susceptibility vessel sign (GRE SVS)". However, Schellinger et al. reported that the GRE SVS can aid in diagnosis of ischemic disease but does not predict recanalization. Previous studies have focused solely on the presence of GRE SVS and recanalization after thrombolytic treatment. Correlations between thrombus size according to GRE SVS and recanalization after IV-tPA have not been thoroughly investigated.
The current study was conducted for analysis of the relationships between thrombus size of GRE SVS and recanalization after thrombolytic therapy using IV-tPA.

Image analysis

GRE SVS was defined by hypointense signals in the cerebral artery in axial section T2*-weighted gradient echo images of the territory that corresponded to high signal on the DWIs. MRI examinations were performed on a 1.5 T unit. The common MRI parameters for DWI and GRE were an equivalent slice thickness of 5 mm, an interslice gap of 2 mm, 20 axial slices, and field-of-view of 220 × 220. DWI parameters included a repetition time (TR) of 3000 ms, an echo time (TE) of 73.5 ms, and a matrix number of 160 × 160. GRE parameters were TR of 550 ms, a TE of 20 ms, a matrix number of 256 × 192, and a flip angle of 20°. MRA parameters included a flip angle of 20°, a matrix number of 256 × 192, a field-of-view of 210 × 210, TR of 25 ms, and TE of 6.3 ms.
For estimation of thrombus size, which can represent the actual thrombus volume, the cross-sectional areas of the GRE SVSs on the initial MRI were calculated. The approximate volume of the mass on MRI can be expressed as summation of the products of cross-sectional areas and slice thickness. The average diameter of M1 is 3.35 mm. Therefore, GRE SVSs on M1 usually appeared in a slice, and we calculated thrombus cross-sectional area as a representative value of thrombus volume. Radiographic estimations of the cross-sectional areas of the thrombi based on the GRE SVSs were performed using the Picture Archiving and Communication System (PACS; Maroview version 5.4, MAROTECH Inc., Seoul, Korea) and a region of interest (ROI) calculator (Fig. 1). When the GRE SVSs appeared in two slices due to curvature of MCA, the areas were summed.
Recanalization was defined as the reappearance of the distal part of the occluded vessel on the follow-up MRI. In following TFCA, recanalization was graded according to Thrombolysis in Cerebral Infarction (TICI) scores (Grade 0: no perfusion; Grade 1: penetration with minimal perfusion; Grade 2a: partial filling (< 2/3) of the vascular territory; Grade 2b: complete filling of the vascular territory that occurs more slowly than normal; and Grade 3: complete perfusion). TICI grades of 2b and 3 were considered to indicate successful recanalization.

CONCLUSION

The authors found a correlation between thrombus size on GRE and radiologic outcome after IV-tPA. Thrombus size on GRE may be a relative predictor of radiologic outcome. M1 occlusions with small thrombi according to GER SVS were more likely to be recanalized following thrombolysis with IV-tPA. Thrombus size on GRE is a simple diagnostic tool that can be easily measured, for quantitative assessment of clot burden in acute M1 occlusion. It can also be helpful in decision making with regard to use of more aggressive recanalization strategies.


Saturday, September 2, 2017

Arrow Sign (Ruptured MCA bifurcation aneurysm).

A) History:
A 54-year-old woman presented to the emergency department with sudden onset severe headache, nausea and vomiting upon waking that morning. On examination, she was alert and oriented, with a mild right facial droop and a right upper extremity pronator drift. A non-contrast computed tomography (CT) of the head revealed diffuse subarachnoid blood, with a prominent triangular focus projecting into the left Sylvian fissure (Figure).


Axial CT shows diffuse sub arachnoid hemorrhage concentrated in the left sylvian fissure
B) Diagnosis:
-Ruptured MCA bifurcation aneurysm.
C) Discussion:
-The middle cerebral artery is divided into 4 major segments.
-The M1 segment (sphenoidal or horizontal) segment originate from the ICA and bifurcate into superior and inferior divisions.
-The M2 (insular) segment begins at bifurcation of middle cerebral artery, coursing laterally and anteriorly to the margin of the insula.
- The M3 (opercular) segment begins at the circular sulcus of the insula, then loop and curves over the frontal and temporal opercula to reach the surface of sylvian fissure.
-M4  (cortical or terminal) segment consists of various branches that course over the cerebral convexity and supply the cortex.
- When MCA aneurysm is rupture, the resulting sub arachnoid hemorrhage can track along ipsilateral sylvian fissure and outline the frontotemporal operculum, producing an "arrow sign".


Short M1 segment (red) with smaller superior division (yellow) supplying the frontal convexity, and larger inferior division (orange) ointo the the temporal lobe (purple, subdividing into black anterior and white posterior temporal  and white parieto-occipital) and parietal lobe (blue) feeders. 


Friday, September 1, 2017

Absence of Flow Voids.


  • Diagnosis: Brain death.
  • Discussion:

1-Accurate diagnosis of brain death is necessary prior to discontinuing life support in a comatose patient.
2-Clinical examination is only reliable in the absence of hypothermia; barbiturates; sedatives and hypnotics.
3-If the diagnosis is unclear; imaging examination such as nuclear medicine; CT; MRI or angiography may be helpful.

  • Imaging signs:

A)On contrast enhanced MR Imaging -----> Absence of intra cranial perfusion above he level of skull base.
B) On T2 imaging -----> Absence of flow void signs inside arterial cranial vessels.
C) Additional imaging signs:
-Diffuse cerebral edema with obscuration of grey white matter diferentiation.
- Downward transtentorial and tonsillar herniation.
- MR Hot Nose Sign: Nasal and scalp enhancement due to increased collateral flow to external carotid artery.


Absence of intra cranial perfusion above he level of skull base.

Absence of flow void signs inside arterial cranial vessels.

Hot Nose Sign

Tuesday, July 14, 2015

Absent vertebral artery D.D.

Teaching pearls:
1- Retrograde flow in the vertebral artery


A 12-mm thick maximum intensity projection reconstruction from CT angiogram shows a complete short segment occlusion of the proximal left subclavian artery with filling of the more distal subclavian artery via the left vertebral artery. Note minor atherosclerotic change at both internal carotid artery origins without significant stenosis. This patient was asymptomatic and was managed without revascularization.
Gadolinium-enhanced magnetic resonance angiogram (MRA) of right carotid-subclavian subclavian steal phenomenon. This tangential aortic arch maximum intensity projection view shows innominate artery occlusion and severe left proximal subclavian artery steno-occlusive lesion. Two-dimensional time-of-flight MRA confirmed retrograde flow in the right vertebral but not in the left vertebral artery. MRA tends to exaggerate the severity of steno-occlusive disease. While this MRA suggests a short occlusion of the left proximal subclavian, a severe stenosis rather than occlusion was documented on conventional catheter arteriography.


MR-angiography 3D-TOF showing a cavernous sinus mass and occlusion of 
the intracavernous carotid artery.


Gadolinium-enhanced axial T1-weighted MR image revealing left cavernous sinus enlargement by isointense lesion with anular enhancing (arrow). 


Reference